Existing formatting is not removed by Table Auto-Formatting. Here is how to handle the situation.

Contents
Existing manual formatting interferes with Table Styles
By default, the blue and white table formatting is applied automatically. Of course, you can change that to any other available styles.

Unfortunately, real life is more complex than ideal situations. In many cases, you will already have some manually formatting applied to the data.
If there is manual formatting applied, Excel Table DOES NOT remove it before applying its own automatic formatting.
Why not? Because Excel cannot override what you (or some other human being) has done intentionally – without asking you. It does not want to trouble you by asking whether you want to override and remove the manual formatting – that would be very irritating.
So to be on the safer side, it just keeps manual formatting as it is. In this case, the default formatting does not appear. Depending upon the extent of manual formatting, some automatic formatting may be shown partially. This looks very bad and confusing.
How to handle this situation?
You need to look at the manual formatting and decide if you want to get rid of it. If yes, then you need to explicitly ask Excel to override it and apply default Table Style based formatting.
How is this done? Well – right click!
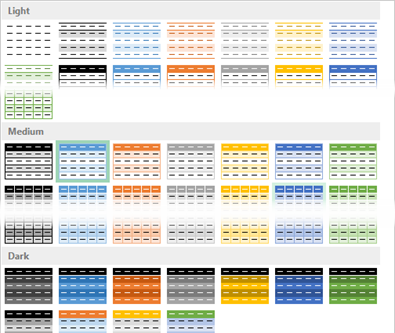
Right click on the desired Table Style and choose Apply and Clear Formatting. The “formatting” mentioned here refers to manually performed formatting.
Now it will work as expected.
DO NOT DO THIS BLINDLY. STOP. READ the rest of the article and then decide.
This is NOT safe
At this stage, you may be thinking that the problem is solved. Unfortunately NOT.
The problem is that we apply formatting not just to improve the look and feel. There are two distinct reasons why formatting is applied:
- To make the data “look good”
Of course, what looks good to one person may look horrible to someone else, but that is a different topicaltogether
- To indicate some meaning
This is the one which is more important and dangerous.
Does the formatting MEAN something?
Consider this data. There is yellow and orange background color used. This is not used to make it “look good”. That color MEANS SOMETHING.
Unless YOU were the one who applied that color, you will not know what it means. But usually it means something.
Now, if we override that color by using the option Apply and Clear Formatting we will lose that meaning forever! That is why it is dangerous to use this option without thinking.
The right approach
It is important to find out what that color coding means. Probably “yellow” indicates delivered orders and “orange” means delayed orders… try to find out.
If you cannot find out, at least retain that meaning by adding another column and coding it manually. I know this is additional work. But it is required to retain the meaning.
Now, even after the formatting is removed, the meaning is retained.
If the data is too large and there are too many meaningful formats used, DO NOT override the Table formatting. Keep it as it is. Find out the meaning from someone who originally did the formatting and then repair the data.
NEVER use formatting INSTEAD of meaning
This is a general best practice. Never use formatting as the ONLY WAY to convey information. Add it as a column and explicitly put it as data. Formatting cannot be a substitute to data.
Of course, once you have the data, you can use that to apply visual formatting to cells using Conditional Formatting. In this case the formatting is an adjunct (not substitute) to data.
Read this article for details:
Worst Practice- Using formatting as a substitute to information
What Next
In the next article we will see how to create New Tables. Of course it seems very easy. But apart from creating a table, what is more important is to think a little more and add correct columns. There are many mistakes made commonly at this stage and these mistakes increase everyone’s work exponentially when it comes to analysis.
Therefore, let us learn to prevent common data related mistakes at the time of creating a fresh new Excel Table.
Related Articles
This article is a part of Knowledge Pack – Excel Tables
***
***


3 Responses
I often face this situation where users have applied colour-specific meaning to data.
And as recommended by you Doc, I too add another column to the raw data, which contains the colour index of cells in the coloured (shaded) column.
For this purpose, I use the UDFs available on Chip Pearson’s website at this page:
http://www.cpearson.com/Excel/Colors.aspx
Specifically the ‘ColorIndexOfOneCell’ UDF is very useful in these situations.
Yes. I will be covering the color management issue soon. I prefer COLOR to COLORINDEX.
Reblogged this on SutoCom Solutions.