
Text to word list and search
This is the continuation of the earlier video Text to word list and search. Earlier we started with a list of text and identified individual word and their frequency of
This is the continuation of the earlier video Text to word list and search. Earlier we started with a list of text and identified individual word and their frequency of
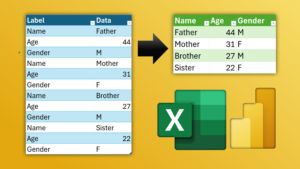
Pivot data using Power Query and Convert flat data with key – value pairs to tabular data. Simplify analysis. Use Power Query – Pivot Column for conversion. Download Sample File
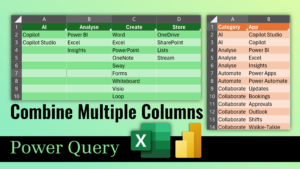
Clean-up data quickly using the amazing Power Query Convert multiple column data into two columns using Excel or Power BI with the UNPIVOT feature of Power Query. Download sample file

Analyse and calculate the amount of time each employee stayed in a role, department, grade, or any other parameter you have. Use Pivot Table + Calculated Column + Conditional formatting

Learn about column profiling and column distribution while importing data using Power Query. Related Videos Multiple header crosstab data clean up – Excel – Power Query Eliminate VLOOKUP using Excel

Learn how to show more useful information easily using a ribbon chart in Power BI. It is better than stacked column chart because it shows proportions as well as ranking.

In this video, I will show you how to use Power Query to split a column by a delimiter and create new rows for each value. This is useful when

Learn all about sorting in Excel. Simple sort, multi-level, custom order, formatting and more … Two detailed videos. First one is about native Excel features. Second one is about automating

Learn how to interactively filter data in Power BI reports using Slicers. Slicers are a powerful tool that allow you to filter and customize your data visualization in Power BI.


