
Powerful Image Analysis using Microsoft 365 Copilot
Powerful Image Analysis using Microsoft 365 Copilot. Try it with your own images uploaded and interpreted and analysed. Related videos Check out my Copilot playlist with 65+ videos
Powerful Image Analysis using Microsoft 365 Copilot. Try it with your own images uploaded and interpreted and analysed. Related videos Check out my Copilot playlist with 65+ videos

Explore this Microsoft Copilot Prompt Coach Agent Masterclass and learn to write effective prompts and get better results. Contents Intro – 00:00 Install Prompt Coach – 00:24 Cant see Prompt
Work or Web? Learn which one to use when, with simple things to keep in mind or ask yourself using M365 Copilot. Related videos Check out my Copilot playlist with

Explore the Six ways to use the unique and amazing Agent Mode with Copilot in Microsoft Excel. Perform complex actions with ease. It works on a single Excel file and

Create new font in your handwriting for free using a touch screen and stylus (pen tablet) in TTF format on Windows font maker. Use your own handwriting. Save the font

Learn how to use Brand template with Copilot in PowerPoint with minimal effort and reliable repeatability anytime. Just follow the instructions below and make it your own! It is a
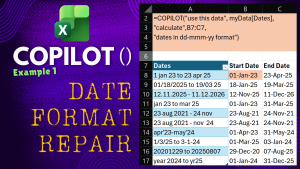
Fix ANY Date Format in Excel with Copilot Function without any Macros. Got dates in multiple, different and difficult formats? No problem. “COPILOT()” function understands them. When you cannot use

Meet the new Copilot UI in Microsoft 365! The homepage has been updated, and soon everyone will see the updated UI. If you have the paid version, you’ll find two
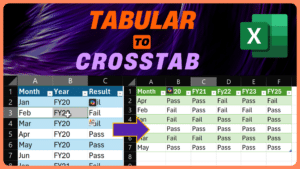
Convert tabular data to crosstab – Power Query. Let us understand this simple but useful task in Microsoft Excel. Download sample file Related videos How to enter and edit Excel


