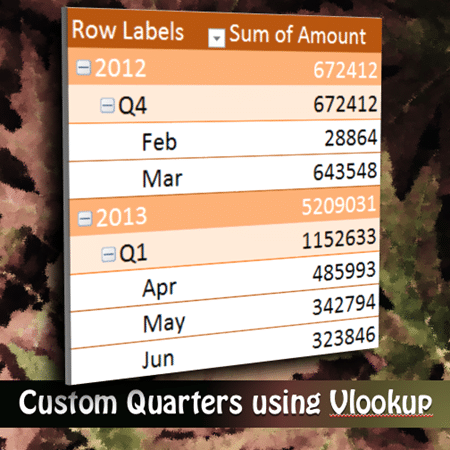
Date grouping using custom quarters or periods can be done using VLOOKUP. This is a very powerful and quick method for creating reports.
Estimated reading time 7 min
Potential time saving – enormous
This article is a continuation from the previous article:
Grouping Dates into months, quarters and years – in seconds!
Contents
Non-Jan financial years
Many organizations have the financial year beginning in April or July. The default Pivot Table based grouping assumes that the year begins in January. This setting cannot be changed.
That is why we need to use VLOOKUP to create our customized ranges and create groups.
Download sample data and follow along
Create the lookup table for Quarters
You need to create a RANGE lookup table. To understand how this is done, please read the article: Ageing Analysis (Bucket Analysis) using VLOOKUP – Part 3
Look at your raw data and find the earliest date you need to analyze. The lookup table must have dates from that financial year. First column shows the starting date of each quarter. Second and third columns should contain the Quarter and Financial year and another column combines the quarter and FY description.
You will need to use it for multiple files. Therefore, create a large lookup table which covers all the past and future dates you will need to handle. Keep it in a separate file and then use it for VLOOKUP.
For demo purpose, this table is in the same sheet as the raw data. I have named the table as Quarters.
Using VLOOKUP to map each date to Quarters
Add a new column in the raw data and use VLOOKUP as shown here.
VLOOKUP takes each date, searches for it in the first column of Quarters table. When it finds a fit, we want the caption from the fourth column – which shows the financial year as well as quarter. Finally the last parameter 1 indicates to VLOOKUP that we are not looking for exact dates – we want to search in between the dates as well.
Now create a Pivot Table for Quarters grouping
Simple. Job done.
Do you want Year, Quarter and Month?
We have put month and quarter as a single column. Month column can be created by grouping the dates. Alternatively it can be created using a formula in the raw data as well.
Remove the Quarters column temporarily. Drag the date. Right click in it- Group by Months. Then add the column Quarters.
Notice that here the Year and Quarter is a single item. Not two different levels.
Three level Year, Quarter and Month
In this case, it is best to go to the raw data and only pick up the quarter column instead of the FY and Quarter caption.
Now add one more column and use another VLOOKUP to get the Financial Year from the Quarters table. (Year is column number three)
Now group date by Months, and add FY and Quarter columns. This way you will get a three level hierarchy.

Notice that in 2013, it is showing Q4 first. You have to reorder the Quarters to get in in the correct order. Click inside the Q4 cell. Move the cursor to border till it becomes a four headed moving arrow and rearrange.
There is another way called Custom Lists.
We will cover that approach in a separate article.
Convert months in raw data itself
Add another column and put a simple formula – to show months.
Custom Months
Sometimes, due to sales pressure or overload, the actual month does not end on the last day of the month. It spills over to few days into next month. In such cases, the monthly grouping will give wrong results.
Now you know what to do. Create a Month lookup table – same as the quarter one. Each row should show the ACTUAL first date of the month. Then add two columns where you will have to manually add the month and Year.
Use this as lookup table and then create a pivot table. Try it out.
What next?
We discussed about dates grouping. Sometimes, dates are also accompanied with Time portion. Depending upon the context of analysis you may or may not want the time portion to be considered.
We will see how to group data by days and hours in the next article.
Articles in this series
Grouping Text in Pivot Tables
How to correct spelling mistakes while analyzing data?
Ageing analysis in seconds (Number Grouping in Pivot)
Ageing Analysis (Numeric Grouping in Pivot) – Part 2
Ageing Analysis (Bucket Analysis) using VLOOKUP – Part 3
Grouping Dates into months, quarters and years – in seconds!
Custom Date Grouping using VLOOKUP (this article)
Grouping with Date – Time Data using Pivot
***


