Bin or Bucket Analysis is a common requirement. We will see how easy this is using Grouping feature of Pivot Table.
Estimated reading time 10 min
Contents
Download sample file and follow along
The Need
Here is a business scenario for Accounts Receivables. However, this concept can be applied to any kind of bucket / bin analysis / ABC analysis.
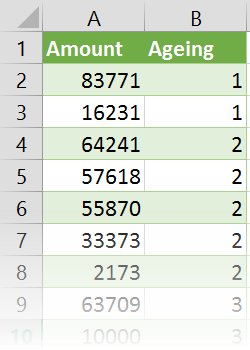
Open the file. There are only two columns – to keep things simple. Amount and Ageing. Ageing is the number of days since the invoice was sent. 200 rows of data. Minimum is 1 day, maximum is 112 days.
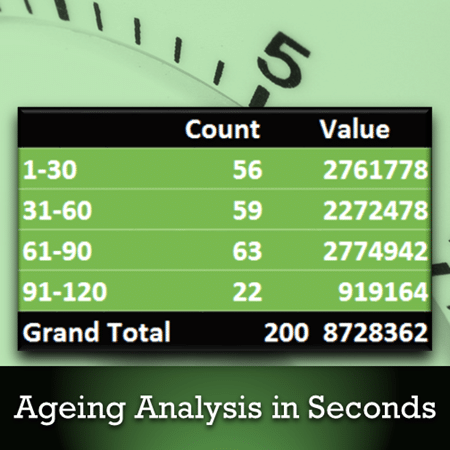
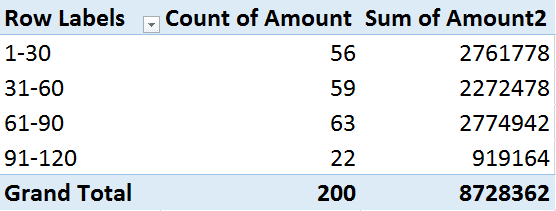
What we need is analysis which shows buckets of 30 days and total amount outstanding along total count of invoices.
Here the assumption is that there is a single uniform bucket size of 30. If you want different bucket sizes, this approach does not work. We have to use VLOOKUP. This will be covered in a separate article.
First thought which comes to mind is usually inefficient!
Many of us think we have to add a new column to the raw data and put multiple nested IF statements like
NO! That is like YOU helping EXCEL.
Here is the right way
Create a Pivot Table
Drag Amount TWICE into data area.
Right click in one of them – Summarize Values As – choose Count.
This way we see the total value and count (volume).
Now drag the Ageing column into row area.
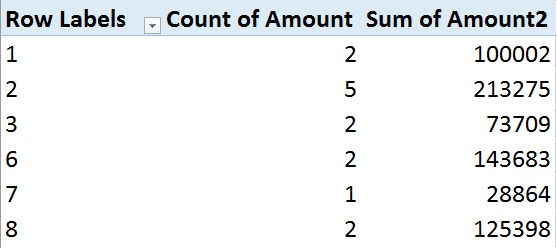
It will summarize the data for each unique number in Ageing column.
For example there are two invoices which are ONE day overdue and five invoices which are TWO days overdue… and so on.
This is too detailed. We just want it summarized by 30 day intervals.
Right click in the Row area and choose Group…
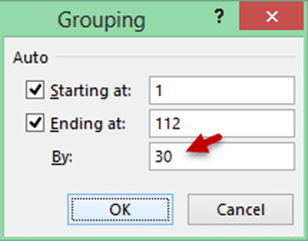
Look at the dialog carefully. Really carefully. Think about each item you see.
Type 30 in the By textbox and click ok. That’s it.
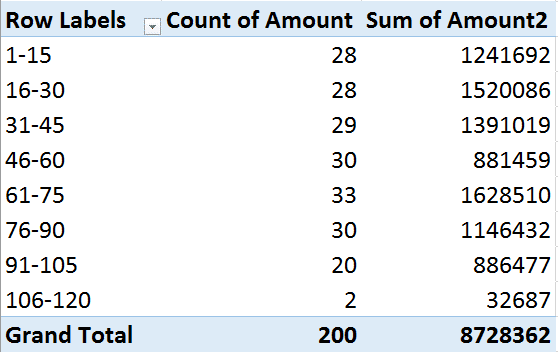
Of course you can go to Group dialog again and change the value to any other number. Pivot will recast the data.
What next?
Just get this thing working first. Try this with your data. Teach this to everyone around you. Of course you will have more questions…
We will cover those in the second part of this article. Also think why I asked you to look at the Group dialog carefully.
Articles in this series
Grouping Text in Pivot Tables
How to correct spelling mistakes while analyzing data?
Ageing analysis in seconds (Number Grouping in Pivot) – this article
Ageing Analysis (Numeric Grouping in Pivot) – Part 2
Ageing Analysis (Bucket Analysis) using VLOOKUP – Part 3
Grouping Dates into months, quarters and years – in seconds!
Custom Date Grouping using VLOOKUP
Grouping with Date – Time Data using Pivot
***

