This is the third article in this series. Please read these articles as well:
Auditors, Risk Managers: Excel spreadsheet analysis using the new Inquire tool
Spreadsheet Analysis using Inquire – Relationship Diagrams
Spreadsheet Risk is very important for everyone – from a single user to a large organization. Because an interpretation mistake or a wrong value can be very costly indeed.
In this article we will see how to compare two spreadsheets. Using the old method and the new amazing tool which comes with Office 2013.
Prerequisites
This tool is available only with Office 2013 Professional Plus and Office 365 Pro Plus editions.
Check which version of Office you have (Right click and choose open in new tab)
Contents
Practical scenarios
It is common to have two or more versions of the same Excel file and wanting to know exactly what has changed. The stakes can be low or high based upon what the content of the file is and in what business context it is being used.
Most often we need this when two variations of specifications, quotations, configurations, work breakdown or similar data comes from external parties. These could be vendors, suppliers, service contract companies, outsourcing agencies or myriad of other situations.
The original copy is modified after negotiation, cost cutting, customization, inputs from stakeholders and so on. The revised version needs to be compared with the original to ensure that desired changes have been done and no undesirable changes have been made.
In fact this type of requirement exists with Word documents as well. We will cover that in the next article. However, unlike Word, where Track Changes is routinely used, most people do NOT use Track Changes feature in Excel.
In the absence of tracked changes, you must compare the files post-facto.
Auditing critical internal files is another common scenario. Financial and statutory reporting is a repetitive and complex task. Multiple persons work with large and linked spreadsheets in an iterative way often in a stressful, time bound manner. This is very prone to mistakes of omission. Therefore, auditors and risk managers may need to quickly compare two versions of files to find out the exact modifications and their impact.
Fraud investigation is an obvious need here. Intentional manipulation of Excel formulas can be done for personal gain or other malicious activities. Comparing files is an invaluable tool in such investigations.
Of course, troubleshooting is another common need. A complex file which was originally working flawlessly is now broken or yielding erroneous results. Now we need to check what changed to find out and correct the errors.
This feature can also be used effectively for creating Documentation of multiple versions of files in an evolving solution or complex spreadsheet which is undergoing incremental improvements. Manually documenting changes is cumbersome as well as error prone.
SharePoint versions of documents are another common scenario. Document libraries in SharePoint can be configured to automatically store past version of a document whenever a change is made. You can then open any two versions and compare them to analyze the changes. You must save the copies locally for this to work. Spreadsheet compare tool does not know how to open two versions of the same document from SharePoint.
How to start Spreadsheet Compare tool
This can be done in two ways.
Firstly, open the files you want to compare, open the Inquire tab and choose Compare Spreadsheets.
Choose the files and click Compare. The Swap button is important. The Original version should be on top and the Revised version should be at the bottom.
Now a separate application opens and shows the comparison.
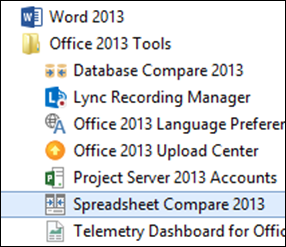
The second method is to start the Spreadsheet Compare tool from Start Menu or search for it. It is usually installed into Program Files – Microsoft Office 2013 – Office Tools section.
There is also a very powerful and useful Database Compare tool for Access.
The same windows which we got in the first option is opened here as well. The difference is that we have to now select the workbooks to compare. This is basically a stand-alone tool which is simply invoked from the Inquire tab.
How to perform the comparison
The comparison can take a long time for complex files. But it is comprehensive. It compares values, formulas, formatting and inserted / deleted items (rows, columns, sheets). Even if multiple rows / columns are inserted in the revised file, it intelligently understands how to compare existing data.
Inserted and deleted rows are NOT compared by default. You must change the settings to make this happen.
If you have password protected files, you can create a password list. This is convenient but not a very secure way.
The System Generated changes option is Off by default. What is this thing?
These are changes to formulas which are made by Excel automatically when you insert or delete related rows or columns or if you move cells. These changes are automatically managed by Excel and not done by human beings. Therefore, these can be safely excluded from the comparison. However, for troubleshooting this may be a handy option.
Understanding the changes
Changes can be many and complex. These are color coded for simplifying the interpretation and assimilation of the comparison results.
These colors are used. This display is useful as a legend for color coding. But it also allows you to show or hide comparison of the specific items. Depending upon your needs, remove the unwanted items before you proceed. This way the visual and discretionary work you have to perform will be minimized.
Once you gain specific leads or indications, you can always activate any option and explore deeper. For example, if you are suspecting or troubleshooting a formula error, turning off the Cell formatting comparison is appropriate.
What it cannot compare
This is very important to understand. The simple answer is – whatever is NOT mentioned explicitly in the color coded list above is NOT compared.
This includes objects, charts, comments, PowerView sheets and so on. Also notice that it does not work with PowerPivot data models. Pivot Table value changes will be detected but the underlying setting change – like changing from Sum to Count – will not be detected.
List and comparison
The layout of the comparison tool output is highly usable. But it can be confusing initially. Here is how the data is shown.
Click on the list of change row to see the original and revised version of the item.
You can see formulas instead of values if required. The important thing to note is that the color is used uniformly in the Change List as well as both the files being compared.
The color for a specific type of change is used as Font color in the list of changes and background color in the compared worksheets. For example, Formula change is shown in this color .
Workbook formatting is NOT shown
This tool uses so many different colors to illustrate different type of changes. In order to make the color coding visually standardized, the original formatting in the Excel files is NOT shown. Otherwise accidentally matching formatting from the spreadsheet will confuse the person interpreting the comparison results.
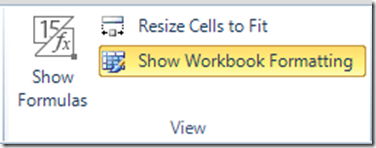
If, however, you want to see the formatting, it can be shown using this button…
Why would you want this? May be because you are troubleshooting conditional formatting. May be the formatting in the workbook is not just for aesthetics but it has a business meaning.
Double click to see details
In the details pane, double click on a comparison item to open it in the special editor. This is very useful for highly descriptive or long items like complex formulas, descriptive fields like narration or for troubleshooting VBA code.
Things which are not changes are shown in white. Original item in red and revised item in yellow.
Chart
The chart shows various types of changes in a graphical form. It is a good way of visualizing the overall picture. But not very useful for detailed analysis or troubleshooting.
Report
The changes can be exported to another Excel file as a report. But that report is absolutely colorless. It is not even an Excel table (which I feel it should have been). This report is more useful as documentation rather than as an analytical tool.
Copy to clipboard
I don’t see any reason to use this option unless you want to copy paste the entire results manually into an existing Excel file. This option copies the ENTIRE report into clipboard.
Your turn
Now that you know about this tool, I am sure you will use it often. Do post your feedback and experiences as comments.
Professional level Spreadsheet Control
The Inquire and Spreadsheet Comparison tools are good for individual files and specific scenarios. However, if you have a large number of critical business spreadsheets, monitoring them manually is practically impossible.
That is why there are two other tools you should know about.
Microsoft Discovery and Risk Assessment Server, provides inventory and analysis features which help you identify critical files based upon the materiality and complexity of files. Microsoft Audit and Control Management Server helps you monitor the changes being made to the critical Excel or Access files.
Both these are extremely robust tools required for any organization which needs auditing and proactive risk management of Spreadsheet related operational risk.
I will explain and demystify these products in future articles.


