These two roles require extensive work with complex workbooks. Auditors need to understand and validate large, complex workbooks in a time bound manner. Risk managers work with complex models with large data sets. They want to implement Spreadsheet Controls in place to reduce the operational risk originating from spreadsheet errors. In either case, you need to understand, validate and troubleshoot spreadsheets in a time bound manner.
In this article, I am not going to cover the regular features of native Excel which include GoTo Special, Trace Precedents, Watch Window, Evaluate Formulas and so on.
Since Office 2013, Microsoft introduced a new add-in called Inquire tool– which is very powerful. But still many people do not know about it. We will explore this tool in this article.
Contents
Summary: Inquire Tool
If you analyze and audit large, complex and critical spreadsheets, you must explore and use the new Inquire tool, which is a part of Office 2013 professional plus. It provides extensive analysis of values, formulas, linkages and dependencies. Performs detailed comparison of two versions of the workbook. It also cleans up excessive formatting. Detailed reports are generated. Excellent for audit, troubleshooting and forensics.
The Need: Inquire tool
Excel files can become very large and complex. Understanding the details of its contents by traditional methods is time consuming and complicated.
Looking at the overall contents of the file at a glance is required for various reasons.
Auditing a file is the most common requirement. Auditors usually have very limited time per file and they are usually not familiar with the files because they have not created those themselves.
Forensics is another reason. If you suspect some kind of fraud or manipulation, you want comprehensive understanding of the file.
Validating critical files is another common need. Few Excel files are very important from a business point of view. Important, high impact and costly decisions are often taken by looking at complex forecasting data, business plans, break-even analyses, production plans and so on. Before taking any decisions it is a good idea to check that the file structure, logic and dependencies are right. A mistake can have a large impact.
Troubleshooting complex files is also required quite often. The file may have been created many years back and changed hands multiple times. Numerous modifications make the file difficult to read. Usually there is no documentation whatsoever to help you with the logic or the structure.
Handing over to a new person who is joining in your position is also a very important, common requirement. New person needs to assimilate the construction of the file and get up to speed quickly. There will be many such files which need to be handed over in a short period of time during the transition phase.
Reverse Engineering a file for enhancing the logic or VBA automation is one more scenario. Often files evolve over time with multiple people involved in the process at different point of time. Usually these files are just passed on to the next person without much documentation and deep understanding of the logic. As long as it works, nobody wants to go deeper into the logic. However, if a new feature or functionality is to be added, the current owner of the file has to understand the workbook design in greater detail. If you want to write VBA code, more details are required to ensure accuracy of data processing. Ranges, dependencies, logic and formula resilience needs to be tested.
Quickly grasping the workbook structure and logic while performing efficiency optimization assignments. This is the scenario which I am faced with very often. I look at how people use Office tools – including Excel and show them the most optimal method of working. During this exercise, I am presented with all kinds of workbooks by different users and I have to not only understand the logic but also evolve the most efficient work method in a very short period of time. Inquire is invaluable for this type of work.
Inquire is designed to help you with all these requirements.
Where is Inquire tool?
This tool is available only if you use Office Professional Plus 2013. It is not available on Standard edition or Office RT. How to check your Office version?
Unfortunately, those who are lucky enough to have the right edition of Office also have little chance of knowing about this tool.
Why? Because, it is not active by default. Earlier we had to enable things like Solver and Data Analysis tools. Similarly, we have to activate it before using it.
Of course, using Group Policy it can be done. But most IT people don’t know it and users are not asking for it. So it is a classic case of a great tool which is guaranteed to be underutilized – or rather unknown
Enabling the add-in
File – Options – Add-Ins. Now a long list is shown. At the bottom, open the dropdown and choose COM-Add-ins and click Go button.
Now choose the Inquire tool check box. If you are new to Excel 2013, make sure you activate the Power View add-in as well.
Now you should see the Inquire tool tab in Excel.
What does Inquire do
It can analyze one workbook or compare two workbooks. It shows statistics about the values, formulas, sheets, links, errors and many more details.
If you have two versions of a similar file – for example original plan and revised plan, it can also pinpoint what exactly has changed between the two files.
Apart from this, it also has a very useful feature to reduce the file sizes of large workbooks if it is due to excessive formatting.
From an audit and risk perspective, it also gives detailed dependency maps for cells as well as files. Linked files are dangerous because sometimes the linkages break, file names are changed and results may be erroneous.
Decide what you want first
The workbook analysis is comprehensive. Lot of statistics gets generated. If you don’t know what you are looking for, you will soon get lost and confused. Therefore, before you run the analysis, you should know what you are looking for – at least roughly.
Run the analysis
Open the file you want to analyze and click Inquire tab – Workbook Analysis.
Time require will depend upon the size of data and complexity of dependencies.
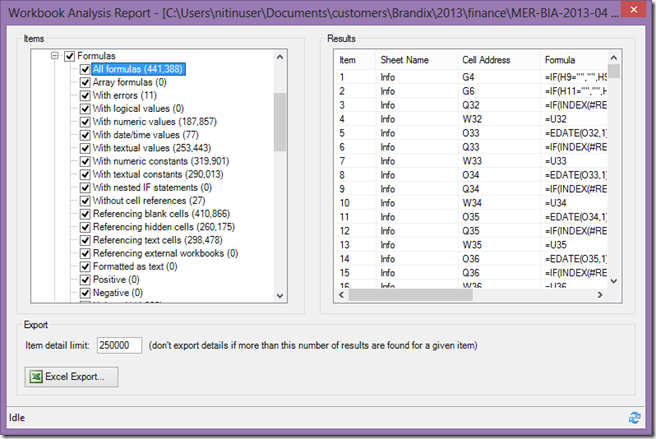
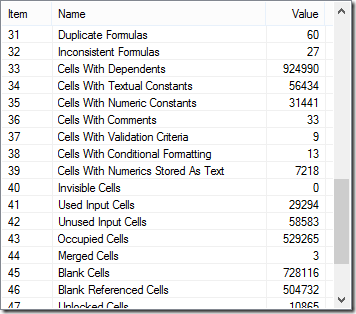
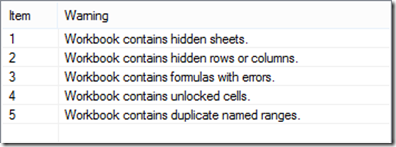
It analyzes Workbooks, Formulas, Cells and Ranges. It also creates important Summary and Warnings.
This data is only for preview. Details cannot be seen here. In order to see details- click Excel Export.
Before exporting remove the unwanted items. Otherwise the report generation can take a long time. Each item has a checkbox. Clear it to remove the item from the generated report.
There is no analysis of Pivot Tables, Charts, Power Query queries, Power Map and Power View. Hopefully this analysis will be added in the next version.
Interesting and Important Items Analyzed
Error formulas
These should be looked at immediately and corrected for obvious reasons.
Very Hidden Sheets
These are specially hidden sheets using the VBA editor by setting the workbook visible property to xlVeryHidden. These sheets are not shown in the unhide dialog. These can only be made visible by using code. These type of sheets are used often by programmers to keep relevant data for their code and applications.
Formulas with numeric constants
Usually, a well designed Excel file will not have too many direct constants inside formulas. All references are usually parameterized. Large number of numeric constants usually indicates poor spreadsheet design.
Often VLOOKUP formulas have the col_index_num parameter hardcoded as a numeric constant. Which is a necessity. It is not a violation of the “never use constants in formula” rule.
Unused Input Cells
These are cells which contain values (constants) but not a single formula is referring to them. This usually indicates raw data. If Pivot Table is created from the raw data it is considered as Unused by the Inquire analysis engine. So don’t worry too much if you see a large number here. It usually means you have raw data which has been referred to by a Pivot Table.
The only thing to check in this case is the Save source data with file setting in Data tab of Pivot Table Options. If this setting is On, it means that your file size is larger than desired because it contains the raw data as well as the Pivot Table cache (a copy of the data made by pivot). Read this article to understand how to handle the situation – Did you know? Pivot Tables can increase the file size!
Blank Referenced cells
Some formulas treat blank cells by ignoring them during calculations. Average related functions will be affected adversely if the blank cell actually means zero. Therefore, looking at the usage of blank referenced cells is important.
Numeric as text
This is an important area to look at. Usually codes which are preceded by leading zeros or similar data is marked as this error. But it is important to be sure.
Analysis Report
Click Load Export File to open the report. The report is an Excel file with one sheet per selected report item.
How to use the report
Well, there is no single procedure. It depends upon the requirement. Here are few general guidelines.
- Before going through the report, understand the objective and context of the workbook.
- Talk to people who have been using the file and try to elicit and document as much information as possible.
- It is usually futile to expect detailed documentation, however it is worth searching for it. If the original file was created by professional consultants or a seasoned spreadsheet expert, you may find at least the initial documentation.
- Open a copy of the file. Ideally make it read-only to avoid changing anything – Mark as final is a good option for this.
- Understand the input, processing, output portions and try to form a mental picture about what may be happening.
- Changing few input values and seeing the end result may help in complex formula driven files.
- Pivot table and chart source data may help in better understanding of the logic and reporting expectations
- Now look at the reports and decide which reports will help you in achieving your goal in the fastest possible manner.
- You also need to use the Worksheet, Workbook and Cell relationships options in parallel while you are exploring the file structure and logic. We will cover these in the next article.
- If you want to document your progress, do not use Mark As Final. Work on the copy of the file and add comments. There may be existing comments but don’t worry. Using Spreadsheet Compare tool – which is also a part of the Inquire system, we can easily find your comments easily.
Of course, this is a generic but logical method. If you have any additional best practices which you have learnt while working on the tool, do post them as comments. All the readers can benefit from your knowledge and experience.
Next article
I will cover the practical usage of Inquire Relationship diagrams in the next article.


2 Responses
Very much underutilized and something that many will use, if they knew it. Thanks for putting this together for an easier understanding…
Thanks Amit.. More articles coming up on Inquire. Dr. Nitin