Using PowerPoint you can convert simple bullets to high-impact diagrams in seconds. Here we learn how to create SWOT analysis diagram and more. Refer to these articles to learn a great feature called SmartArt:
Boring to Exciting ppt – in few clicks!
Marketing: Arranging multiple pictures in few clicks!
Show Off and Learn: Picture Organization Chart in 2 minutes
Video Tutorial: How to show collaboration in PowerPoint
Marketing: How to create “Our Customers” Slide in seconds
Recently I was working on PEST analysis with my good friend Ms. Faith. That is when I thought of writing this article. We will see how SWOT and PEST analysis diagrams can be created instantly using PowerPoint. These topics are commonly used in strategic management and situational analysis.

In case you don’t know about these concepts, read this article.
Contents
Prerequisites
You need Office version 2007 or above.
How to find out which version of Office I have?
Download work-along sample file
This presentation will help you try steps shown below. I suggest that you first read through the article first and then try it out.
Download Sample Presentation from here
Awareness is more important than the operational skill. If you download the file and try it WHILE reading for the first time, your attention will be diverted from the key concepts.
Creating SWOT analysis diagram
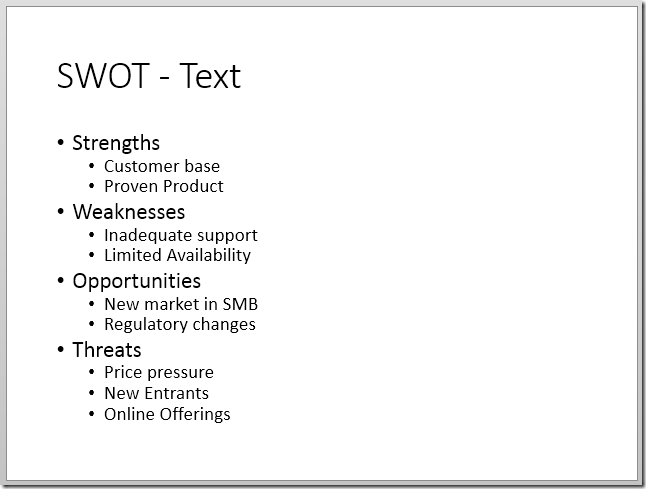
Create a new slide and type the SWOT items. Each category should be a main bullet and the items under it should be level two bullet as shown here.
Converting to diagram is easy. Right click anywhere inside the bullet text choose –
Convert to SmartArt – choose More SmartArt Graphics (the last option).
Now choose Matrix category and choose 1, 3 or 4th diagram. (number of diagrams may differ depending upon the version of Office). In this case I have chosen the first diagram – Basic Matrix. Matrix type of diagrams are good for showing quadrants. That is why only four items are allowed in the top level bullets.

Now the diagram is created instantly.
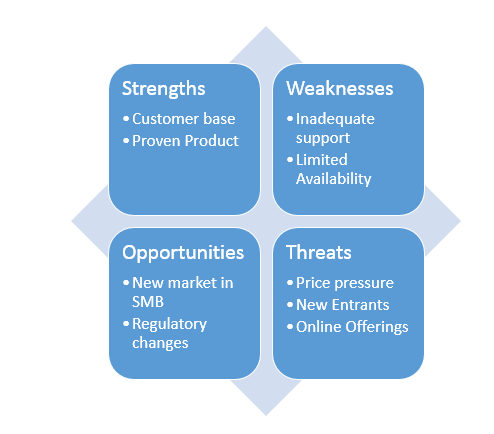
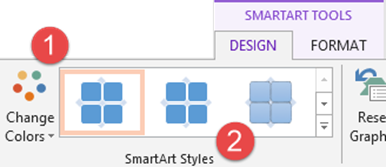
Change colors from the SmartArt Tools – Design – Change Colors option. This is important because each box is showing a different topic. That is why each box should have a different color.
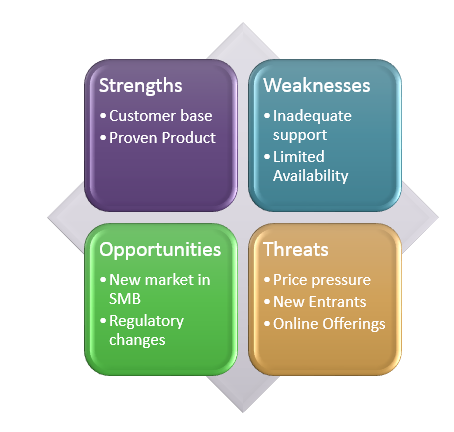
From SmartArt Styles, choose something which makes it look more solid and 3D.
Finally we get a good looking diagram.
Explain SWOT analysis items one-by-one during the presentation
In case you want to build the diagram by discussing items one by one, choose the Animations Tab – Select a simple animation (Appear is good) and then choose Effect Options – One by One
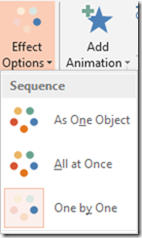
Now you can show the diagram one item at a time and explain / discuss with more control over the presentation. If you show the entire diagram first, usually someone will find their favorite item from the list and start interrupting you.
Changing the ORDER (TOWS diagram)
SWOT slides are critical and lengthy. Lot of debate, conflict and discussion can be expected to happen here. Usually Strengths and Weaknesses section gets all the attention – but these are internal issues usually.
What should get equal amount of attention is the external factors – Threats and Opportunities. However, SW takes all the time leaving very little time for OT.
In order to avoid this, sometimes it is recommended that you change the order to TOWS. Read this HBR article by Michael Watkins for details.
Fine. So we want to rearrange the diagram to show the Opportunities and Threats first. How do you do that?
First of all – DO NOT try to manipulate the text in each shape manually. Locate the arrow in the middle of left edge (two opposing arrows in some versions of Office). Click on it to open the editor.

Now click on Threats and press SHIFT ALT Up arrow. This will move the Threats bullet (along with its sub-bullets) above. Bring it to the top. Then bring Opportunities as the next item. Move Strengths to the last position. That’s it. We have the TOWS diagram created instantly!
PEST analysis
This is an adjunct to SWOT analysis. O and T are external influences. PEST analysis provides more granularity about these influences.
Political, Economic, Social and Technological factors are analyzed. Each of the items could technically be a problem or a good thing – depending upon how you approach it.
As PEST contains four main items and few sub-items, the method remains exactly the same as creating SWOT analysis.
But nowadays there are variations of PEST which require additional things like Legal (SLEPT), Environmental (PESTEL) and Ethical (STEEPLE) items to be also included.
The problem – diagram accommodates only four items!
If you type five items and try to convert to a matrix type of diagram, it will not work.
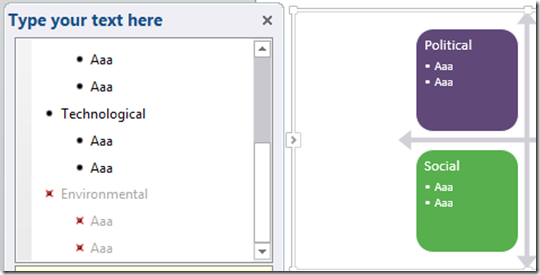
The fifth item will have a small red cross next to it. This cross indicates that the item will not be drawn.
If we want more than four items to be shown, then we have to choose another type of diagram. SmartArt Tools tab – Design – Layouts – More SmartArt

You can use one of these four diagrams. These will accommodate more than four items and still show the concept in an effective manner.
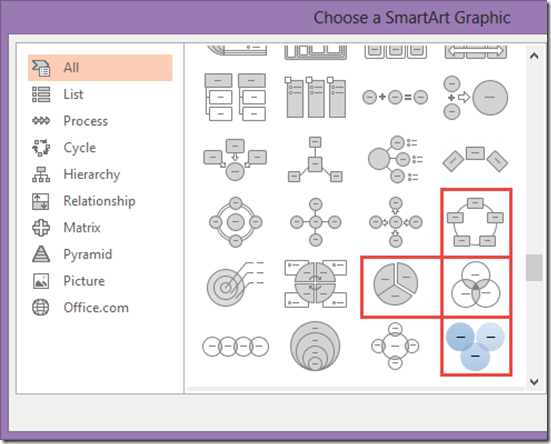
Here are the variations of the same diagrams.

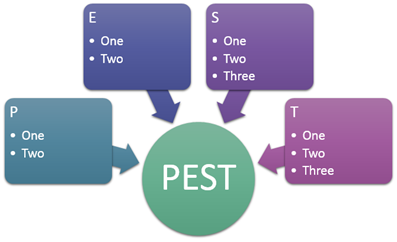
Another type – Converging Radial
If you type the data like this… (three level of bullets), you have another set of diagram choices. Here is one of them called Converging Radial.

What next?
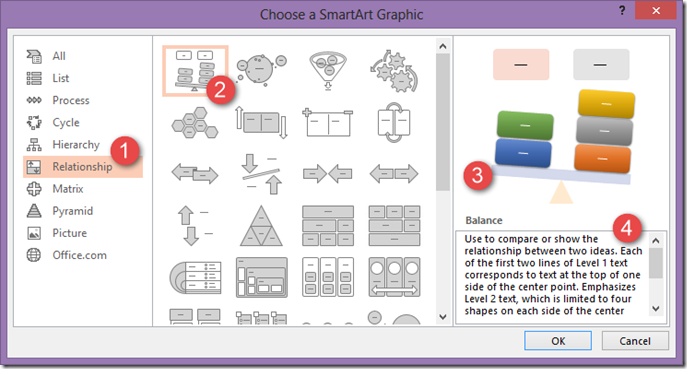
While you are here, explore all diagrams available under SmartArt. Create a new sample presentation. Choose Insert – SmartArt – Click on each category, then click on each diagram, look at the bigger version shown on the right side and read the description below. It will just require 20 minutes of your time but it will help you life-long.
Your presentations will be more effective and visually impactful if you utilize SmartArt in the right manner.
Further Reading on SWOT analysis
If you want to know more about the SWOT, PEST and related concepts, here is a comprehensive article by Dawn Matthews –
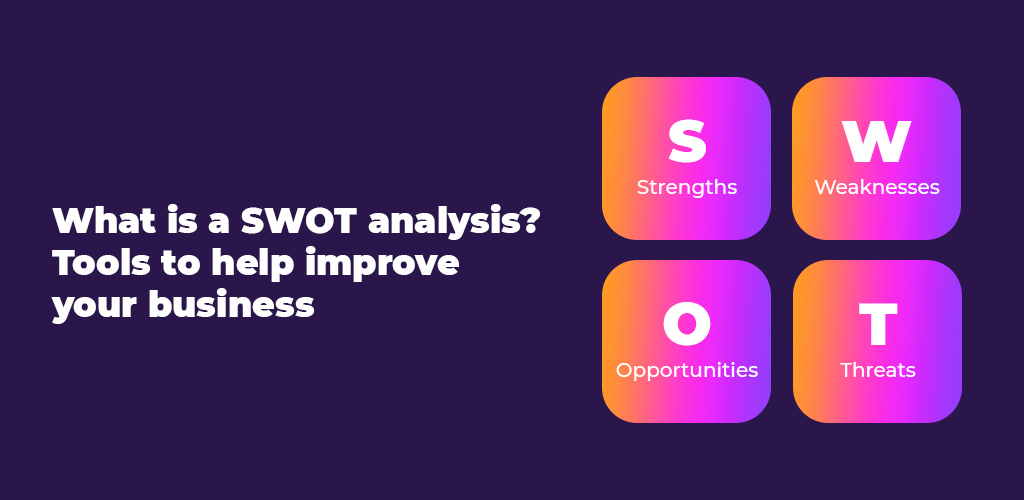
What is a SWOT analysis? Tools to help improve your business
Enjoy!


