Pivot Table is used for data analysis. But did you know that it can also be used for checking data quality?

Estimated reading time 7 min.
Contents
The Need
Pivot Table uses tabular data as input. Often the data is large. Many columns and thousands of rows. We usually assume that the data is consistent. It is not possible to eyeball all the raw data. However, data may contain inconsistencies and mistakes which will affect the accuracy of your analysis.
Therefore, it is a good idea to use Pivot Table as a diagnostic tool before you use it as an analytical tool.
Dragging data into row area
Pivot Table provides four areas. Rows, Columns, Data and Filter.
Dragging any column (also called field) into Row area shows unique items from that column. Depending upon the type of data, it is usually sorted in ascending order.
We know this already. So what is the big deal?
If the data is inconsistent – it usually means there is more than one type of data in the column. For example you may have blank cells in a numeric column or you may have text in a date column. You may even have errors in calculated columns.
Data is sorted by data type
If a single column has multiple types of data, the sorting is done by data type.
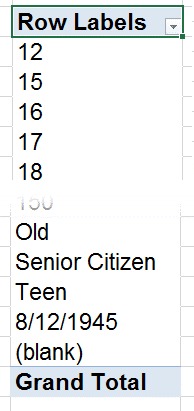
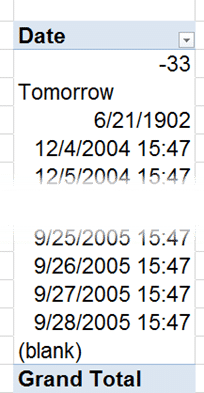
Here is sample raw data and here is the sort order in Pivot Row area.

Thus the order is NUMBER, TEXT, ERRORS, DATE and BLANKS.
Checking for consistency
The concept is simple. Drag and drop ONE column of data at a time. Remember the actual data type expected in the column. Look at the top values and bottom values – you will see inconsistency, if any. Simple but very powerful concept.


Counting the inconsistent cells
This is a quick and useful method to detect inconsistent data for each column. But the information is incomplete without having an idea of HOW MANY cells contain inconsistent data.
We need to count them. That sounds easy. Just put any column in data area and choose count. Better still, drag and drop a TEXT column in data area so that it counts automatically.
But there is a problem with this approach. Why? If there are any blank cells in the chosen column, those items will not be counted – because the count function does not count blanks.
We must find a column which does not contain a single blank cell. But that would be additional effort.
Why not simplify matters by adding a column which is GUARANTEED to have textual data in all rows?
Add a counter column
As discussed in this article, we must always use a table before creating a pivot table. Now go to the first column of the table, right click and choose Insert Column to Left. Rename the column to “Counter”
In the new column, type =”a”
The formula will be copied automatically as this is a table.
Now use this counter column to calculate the count of all the inconsistencies.
Summary
Get data – make sure it is tabular – create table.
Add a blank column – rename it as “Counter” and put some text in each row.
Create Pivot Table. Drag the counter column in data area.
Now, one by one, drag each column from the raw data into ROW area.
Look at the top rows and bottom rows to check for inconsistencies.
Look at the number of inconsistent data items and decide what to do about those items.
***


2 Responses
Hello Dr Paranjape,
After watching my husband cuss and fuss most of the weekend and I was unable to help.. can you please provide information on pivot tables – formatting of – I’m sure there is a quicker and easier way! Also forms & pivot tables… hubby had a data sheet, wanted a form for none techno persons to fill… and add new data to sheet, then be able to update a pivot table to show latest dates… was about vehicles and tracking when things were due; like service, warrant of fitness etc.
Many thanks
Stella (Wellington, NZ)
Hi Stella
I can definitely guide you. But I need more information.
You can either post more specific information about
– what is the formatting issue
– what exactly do you want to capture in forms
– how many people involved in the data entry
– do you have SharePoint or OneDrive for business?
Alternatively, you can send me a mail on nitin@maxoffice.biz with details and a sample file.
Dr Nitin