All of us conduct surveys, get feedback forms or scoring sheets filled. When data is captured in Excel, we typically use Excel Pivot Tables to analyze it.
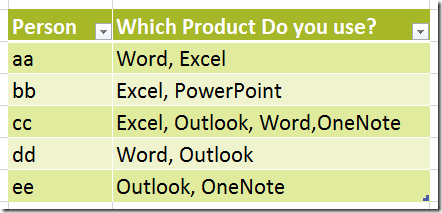
But what if the data is captured as a list of textual values like this? Many professional survey applications often dump the data in this type of format.
Here is a very simple but extremely useful way of analyzing such badly captured data.
This article assumes that you have Office 2010 or 2013 professional edition and Power Query is already installed. You can download and install Power Query from here.
What we want to know in this case is how many people use Word, Excel, Outlook, etc.
Of course there are many potential way of getting this data analyzed… but using Power Query, it not only becomes very simple, it also captures the cleanup steps so that next time the same type of data comes, you just refresh or reuse the query – with no manual effort.
Here is how you do it.
Contents
Create a table
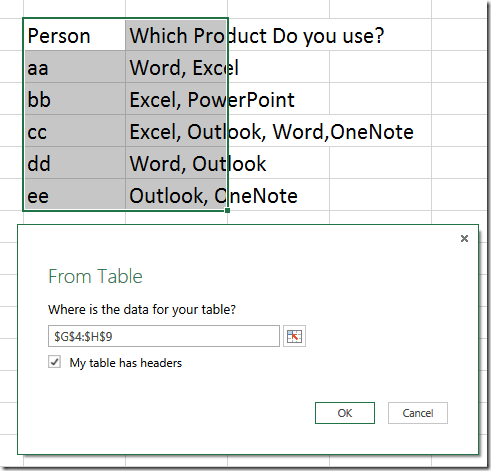
This goes without saying – but still – select the data and Insert – Table. Why? Because Power Query needs a table to work on the data further.
If you don’t have a table, just click inside the data, and choose Power Query – From Table – it will select the data and help you convert it to a table.
Split the column
When you click Ok, Power Query dialog will open and allow you to clean and transform the data.
We want to use comma as the delimiter to split the individual items. Select the second column and choose Split Column from the ribbon.
Choose Comma (which is the default) and click Ok.
Now the column is split into four separate columns…
Unpivot the columns
Now we want to have tabular data from the separate columns. This is called “unpivot”.
Choose the four columns which were split in the previous step, right click on the column header and choose Unpivot.
This will convert the data into the desirable tabular format.
Delete the attribute column and rename the value column to some relevant name (Product in this case)
Remove unwanted spaces using Trim transformation
Notice that there are spaces before some products because the some commas had following spaces. No problem. Right click on the column heading and choose Transform – Trim.
Now we are ready to use the data in a regular pivot table for further analysis. Choose whether you want the data in another sheet or data model and click Apply and Close.
Use Pivot table for analysis
Now we can easily find the answer to the question, which products are used by how many people.
That’s it.
Handling more complex data
If you have some tabular data and some textual delimited data, you will have to create multiple tables. One table for tabular data and one table each for delimited text fields.
You can then create separate pivot tables for performing the analysis.
For example if you have this type of data, you will need three tables.
First table will have Person, Time Spent and Documents created per day. In short, get the one to one data in a separate table.
Second table will be converted to a tabular format using the above method – Person and Products.
Similarly, create a third table with Person and Type of Work.
Now you can get all the analysis you want using three separate Pivot Tables. Of course, if you create relationships, you can also create a single data model based pivot table. However, for easier analysis, I feel it is better to work with three separate pivot tables.
Let me know if you found this useful.


2 Responses
Very helpful. I now see the key is to create two tables from the original. Could then use DAX to set up a many to many relationship.
Hi Donald
I just noticed this unanswered comment. Sorry for the long delay.
Yes we could write all this programmatically. But let us face it, people who capture and analyze survey data may not know (and want to know) DAX.
Even if they manage these steps manually, it is an enormous amount of time saving. More importantly, they can actually analyze the data better and arrive at more informed conclusions and plan better actions.
In my opinion, this is called Commoditization of BI. DAX is still a techie play – which is fine. But it is not for everyone.