Grouping means combining multiple items into fewer items. It helps us consolidate and summarize things to understand them at a higher level of granularity. Let us see how to use Power BI Grouping done easily and quickly. This is useful for Ageing Analysis, Bin or Bucket Analysis, week / custom date range analysis.
Creating Power BI Grouping
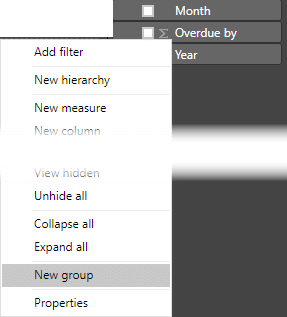
Power BI provides a simple and consistent mechanism of performing grouping for numbers, text and dates. All that you need to do is Right Click on the field name and choose Create Group.
Two types of grouping is possible. Bins based or List based.
List based Power BI Grouping
For text data we can only group based upon the List type. It basically allows you to select two or more items and group them into a single category. Ungrouped items are shown as Other category. For example here, we have divided the Segments into Risky and Safe.
Of course, if a new segment appears in future data, it will go under Others. You will need to edit groupings to repair such issues. This type of grouping should be used only if there are few groups and the data (in this case, segments) do not change often.
If there are too many categories and they change often, it may make more sense to have a separate table containing two columns – the segment and the classification. This table can then have a relationship on the Segment column and provide a more flexible and easier to maintain method of grouping.
Contents
Group icon
The newly created Group is added as a separate field with a special icon – which looks like two overlapping boxes.
Bins based Power BI Grouping
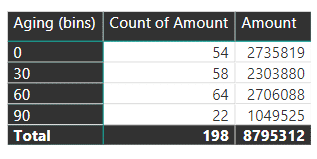
For numeric values, bin based analysis is more common. For example, for payments overdue, we usually perform ageing analysis by 30,60,90, 120 days overdue. This can be done easily using Bin based Power BI Grouping
This gives us ageing analysis easily.
Ad-hoc grouping of numbers by using the List method is also available if required, but it is not very useful if there are too many numeric values. If there are few numeric values, ad-hoc grouping will be useful. For example, if you have just 10 unique values like a score, we can use List based grouping to classify them into low, medium and high categories.
However, if there are too many numeric values, it is better to create a separate table to categorize numbers.
Dates based Power BI Grouping
Dates based grouping is available by default in Power BI. When you add a date type of column to a visualization, it automatically becomes broken down into Year, Quarter, Month and Days.
Bins can be created by specifying the size (as we saw with numbers)
This is very useful if you want weekly groups. By default, Power BI does not give you weekly breakdown. But if you group by days and choose bin size of 7, you get weekly grouping.
Number of bins
By default we create bins by specifying its bin or bucket size. But we can also use another method – by specifying the number of bins. This is very simple. The actual min and max of the column is found out and the range is divided into specified number of bins.
Custom bins require separate tables
Any custom bins require a separate approach.
For example, we want ageing from 0 to 30 and 31 to 45 then 46 to 90… this type of custom bin analysis requires you to create a separate table and then do the math by add a calculated column.
Similarly, for custom date grouping like custom weeks, calendar vs fiscal years and so on, we need a custom date table.


