We have seen many methods of using Excel and related Power BI tools for analyzing data. Now, all that can be done WITHOUT using Excel – using a stand-alone tool called Power BI Desktop. Here is how you do it.

Power BI Desktop – a revolution in analytics
Using Excel, we have many powerful methods of analyzing data. These include Power Pivot, and Power View. In addition, we have Power Query which helps in cleaning up raw data. Now all these three have been combined into a separate and FREE product called Power BI Desktop.
Sign Up for Power BI
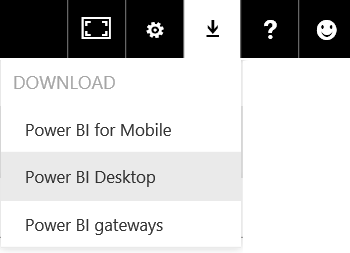
Go to http://PowerBI.com and sign up for the service. Once you are done, download Power BI Desktop application and Install it.

What can you do with Power BI Desktop
Here is a quick recap of what is possible using this amazing tool. This list is more from a functional point of view rather than technical feature listing.
- First step is to get data from one or more sources. These could be simple CSV files, Excel files, databases or many other sources.
- At the time of import, you must check if the data is in GOOD format or BAD format. Good data means simple, tabular data where each column has a heading and consistent data in the column.
- In many cases, the raw data may not be in good format. You can clean the raw data using the capabilities of built-in Power Query.
- Once the data is clean, load it into the Data Model. Data Model is a database containing imported data from one or more sources.
- If you have more than one source of data, you must specify how these are related to each other. This is done by creating relationships between common key columns.
- In addition, you can also add calculated columns as well as very powerful calculated fields using a set of new functions available here.
- Once you are ready with the data you can create a dashboard containing various types of charts, maps, filters and so on.
- Finally you upload the data to the Power BI site and share it with your colleagues, boss or other intended beneficiaries.
- They can view the reports using a browser or even using special apps on Windows, Android and iPhone mobile devices.
- This whole thing is free and does not requires Excel.
- Going one step further, you can also install a Personal Gateway and have the published report refresh on demand or at a defined frequency based upon the changes in the local data. Of course for this to work, the local machine must be ON and connected. But it is still a good idea to get an auto-refresh facility which works on any simple laptop or desktop (rather than a server).

Of course, this is a great new opportunity to create and consume reports. A completely new way which was impossible to implement earlier. I will cover Power BI Desktop and related tools in a series of articles. It is a revolution in the making.
Here is a list articles covering individual components of Power BI tools which work with Excel:
Data Analytics (50+ articles)
***


