Please read the first part of this series before reading this one.
Copy pasting from Excel to Powerpoint a very common activity for business users. You can copy either data or Charts from Excel to PowerPoint.
Contents
WHERE to paste and HOW to paste?
In the previous post, we saw HOW to paste and choose the right format.
Let us address the other question. WHERE to paste.
When you copy (data – not chart) from Excel and Paste it into PowerPoint, it creates a separate object in some cases. This is because we have not explicitly told PowerPoint where you want to paste it. That is easy to do. CLICK or better still – RIGHT CLICK in the textbox or object where you want it pasted.
Please note that this approach does not work in case of Paste Link. The object will be pasted as a separate entity even if you click inside the text box.
Notice the format in which data was pasted
This is best done by looking at the ribbon tabs at the top.
If data is pasted as a table (which is the default), you will see 
If data is pasted as a picture, you will see

If it was a shape or textbox, then you will see
When you click any object, one of these toolbars will appear automatically. Noticing these is a very good idea – it is like Situational Awareness in Office!
Choosing the right format
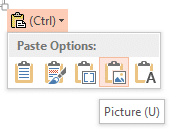
These are the paste options available for Excel data while pasting into PowerPoint.
This is the default and usually nobody likes it because it applies local color theme which is black and white. Therefore, the source formatting is not shown here. The data is pasted as a TABLE. This is very important.
This option uses local theme (colors as per PowerPoint template). It is still a table. So the data is editable. But the problem is that the pasted table looks too small. Trying to make it bigger is gives you a headache.

Embed is a dangerous option. What does it do? It makes a copy of the ENTIRE Excel file and stuffs it inside the presentation. What you see is only the part you had copied. But the file size of your presentation will increase as much as the Excel file size.
This is a good option to send the original Excel file as a Collateral along with the presentation.
This is the option most people need. The data is converted to a Picture. Now you can resize it without distorting it. Remember to remove AutoFilter option before copying – otherwise the drop downs of filter will appear in the picture.
Unfortunately, that means, you cannot select filtered data for copying.
But there is a workaround for it. Hide the header row and copy the header one row above before copying the data! Bad workaround. But that is all we have
This option is the simplest one. It just gives the text. Notice that if you selected multiple columns of data, the text is separated by Tabs – not spaces.
Resizing the pasted object – or resizing anything for that matter
When you paste anything into PowerPoint – and it originated outside PowerPoint – it is pasted perfectly in the center of the text area.
Unfortunately, we often need to resize the pasted object because the default paste was too small to be visible on a slide.
I am sure all of us have found out the hard way that resizing an object without distorting its proportions is to drag from the corner – not from sides.
Resizing from center
The solution is to press 
What next?
In the next article we will see some more nuances of Excel to PowerPoint copy paste:
- How to edit the content AFTER pasting
- Animating the content
- Linking the content to prevent repetitive copy paste
- Embedding the content
- Difference between Link, Embed and Insert object


One Response
Reblogged this on Sutoprise Avenue, A SutoCom Source.