
Create interactive catalogue using Power BI Card Browser visual
Create a visually appealing list of products, services, parts, people, videos, documents and more … use the Power BI visual – Card Browser. Also learn about the new Slicer visual.
Create a visually appealing list of products, services, parts, people, videos, documents and more … use the Power BI visual – Card Browser. Also learn about the new Slicer visual.

Elevate your data storytelling – Use Timeline Storytelling visual by Microsoft in Power BI. Create story elements, present as a sequence. Interact visually. Convert boring data into insightful and interesting

Charticular is a versatile #powerbi visual. We will learn how to create three types of charts – bump, bubble and pictogram. Download sample file and follow along Contents Related videos
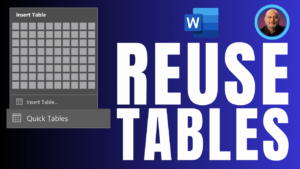
Stop copy pasting tables from documents. Use reusable tables. Create Quick tables from existing tables and use them across Word. Also available in Outlook. Related Videos Word Tables Best Practices

Type tags and get comma list and # list instantly. Have comma list? Convert it to # list and vice versa. Also learn how to use the new and powerful

Learn how to use AI Designer in Microsoft Word. Find and correct formatting inconsistencies and instantly change the look of the document. This is like Word Design Ideas. Contents Related

Every content creator needs a content calendar. Using Microsoft List you can create the most sophisticated and strategic content calendar ever and that too is available for free! Content Related
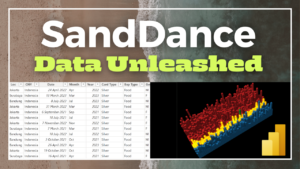
Power BI has a powerful custom visual from Microsoft called Sand Dance It is a UNIT visualization – which means – every row of your data is presented in every

Analyse and calculate the amount of time each employee stayed in a role, department, grade, or any other parameter you have. Use Pivot Table + Calculated Column + Conditional formatting